Zabbix provides powerful monitoring capabilities, but out-of-box configurations rarely suit ISP requirements. Effective deployment demands tuning thresholds, organizing hosts logically, and configuring alerts that inform rather than overwhelm.
Host Organization
Structure host groups to reflect your network topology. Separate core infrastructure, distribution, and access layers. Geographic groupings enable regional teams to focus on relevant equipment. Logical organization simplifies troubleshooting and reporting.
Templates standardize monitoring for similar devices. Rather than configuring each switch individually, apply templates that gather appropriate metrics. Template inheritance allows base configurations with device-specific additions.
Threshold Tuning
Default thresholds generate excessive noise. A trigger at 80% CPU utilization may fire constantly on busy routers without indicating problems. Study baseline performance before setting thresholds; alerts should indicate anomalies, not normal operation.
Graduated severity levels prevent alert fatigue. Information-level triggers for elevated conditions, warnings for approaching limits, critical alerts only for imminent service impact. Escalation paths ensure critical alerts reach on-call staff while information logs for later review.
SNMP Optimization
Polling intervals balance visibility against device load. Core routers may warrant 30-second intervals; customer premises equipment can tolerate 5-minute polling. Aggressive polling creates device overhead; too-infrequent polling misses transient issues.
SNMP v3 adds authentication and encryption overhead. Where security requirements permit, SNMP v2c reduces resource consumption. Restrict SNMP access via ACLs regardless of version.
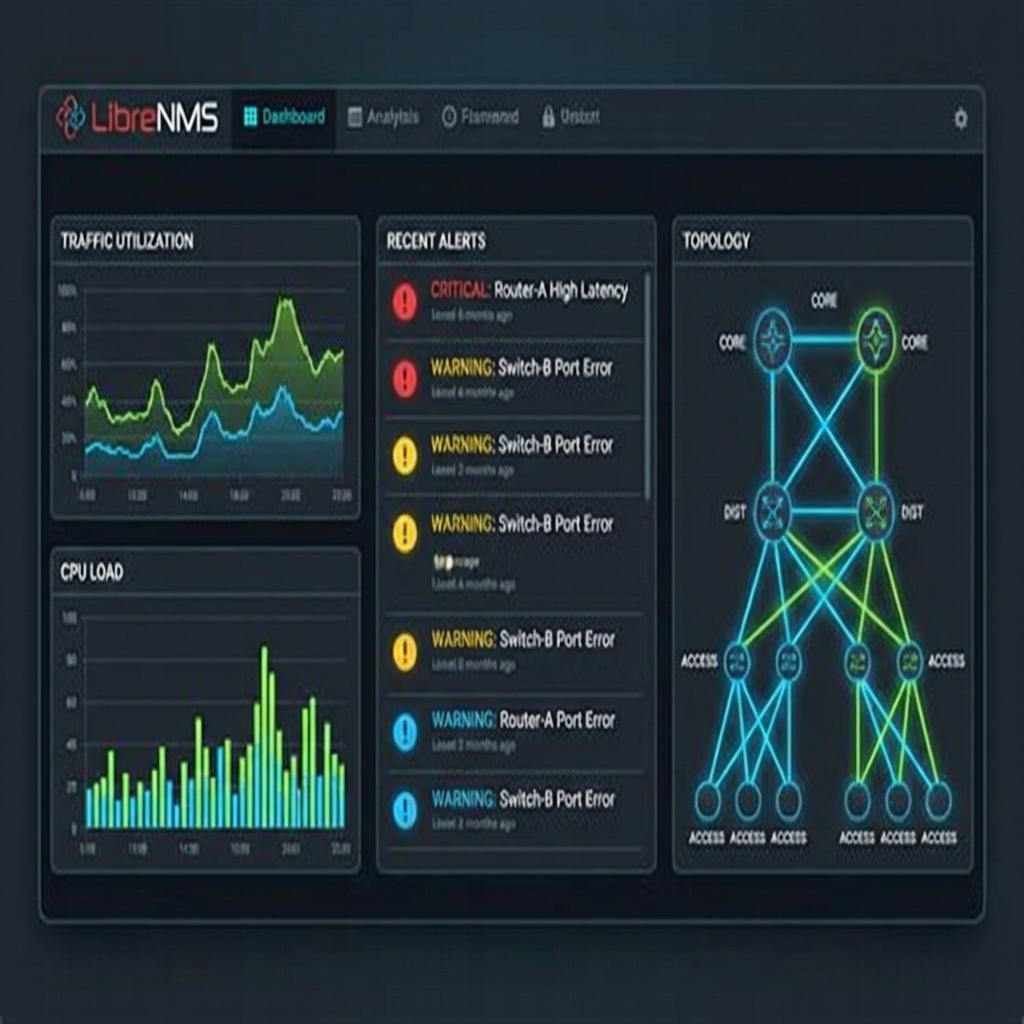
Dashboard Design
Effective dashboards convey status at a glance. Traffic graphs for aggregate utilization, problem widgets for active alerts, and maps showing geographical or logical topology. Avoid cluttered displays that require interpretation; NOC staff should understand status immediately.
Custom screens for different purposes—executive summaries, technical deep-dives, customer-facing reports—serve diverse audiences from the same data source.