Monitoring tells you "The server is down." Observability tells you "Why." In complex distributed systems, you need the "Three Pillars" to debug issues effectively.
1. Logging (ELK / Loki)
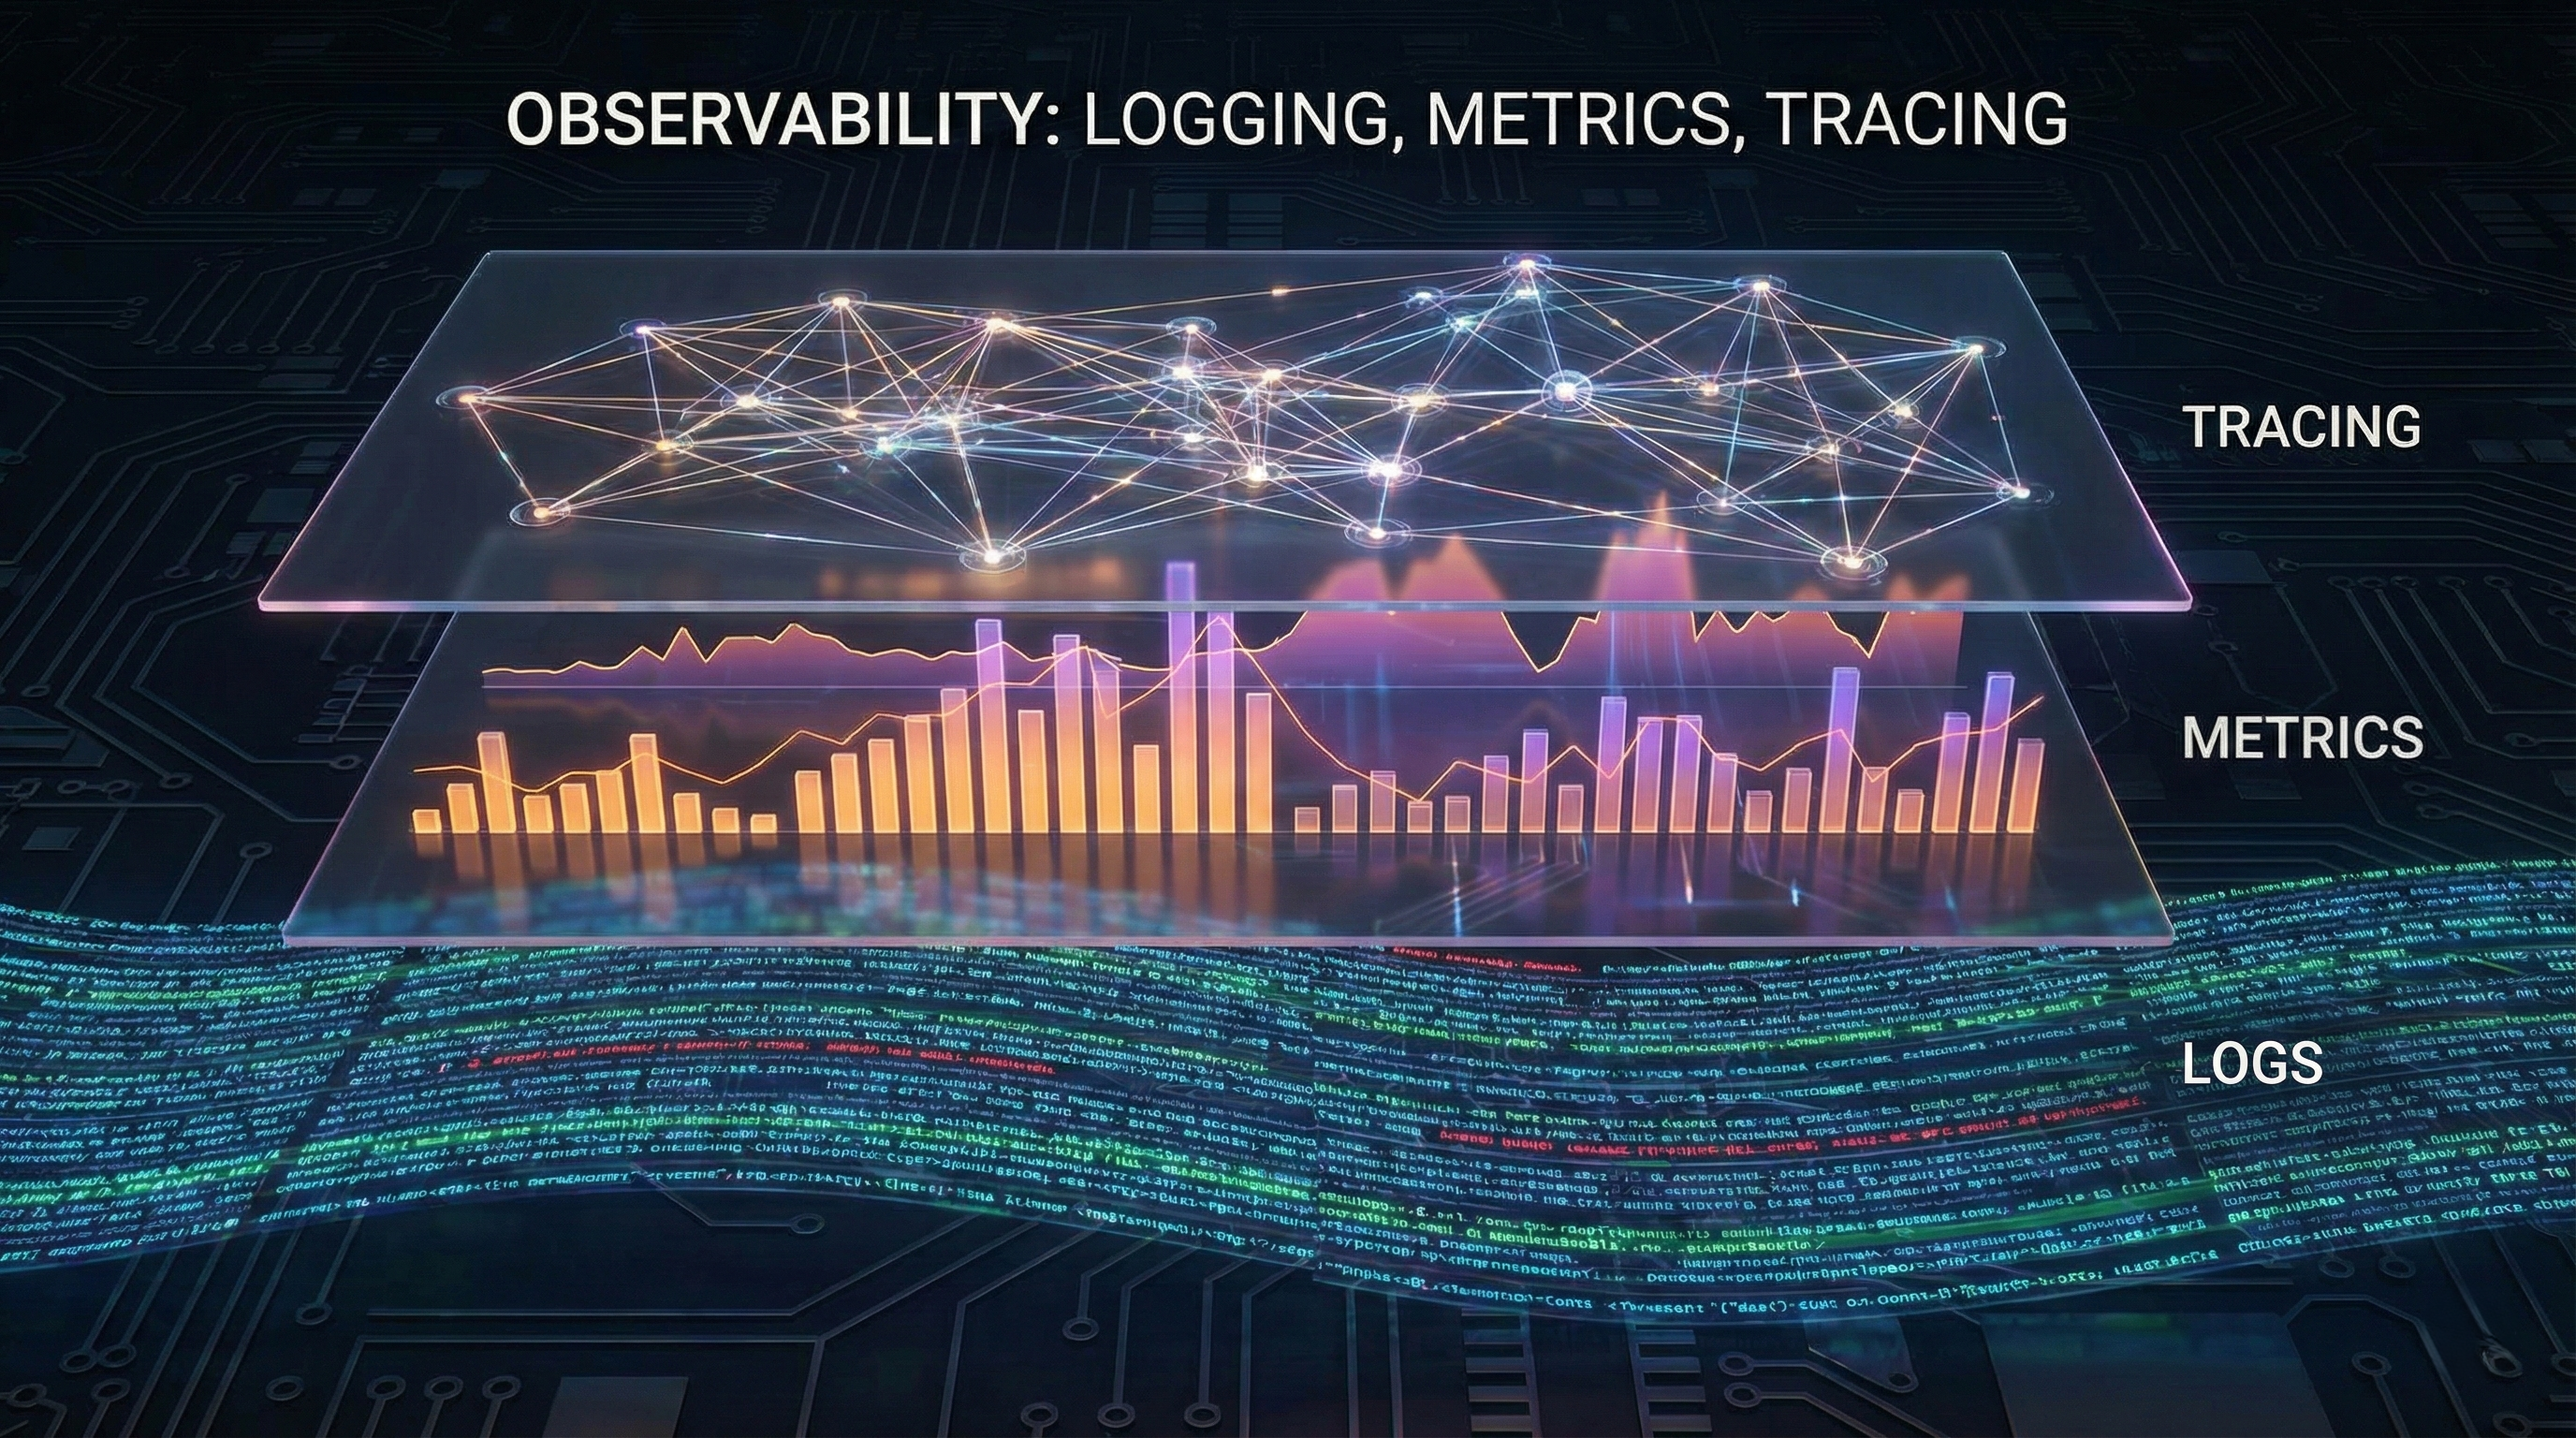
"What happened?" Logs record discrete events. "User 123 failed to login at 10:00 AM." They are high-volume and unstructured.
- Challenge: Storage cost. You generate TBs of logs.
2. Metrics (Prometheus / Grafana)
"What is the health?" Metrics are aggregated numbers over time. "CPU usage is 80%." "Error rate is 2%."
- Concept - Cardinality: High cardinality (e.g., tracking metrics per UserID) explodes your database size. Use metrics for general health, not individual tracking.
3. Tracing (Jaeger / Tempo)
"Where is the slowness?" Tracing follows a single request ID as it hops between 20 microservices.
- The Waterfall View: "The request hit the Load Balancer (5ms), then the Auth Service (50ms), then the Database (2000ms!)."
- Value: It instantly pinpoints the bottleneck in a complex chain.
Key Takeaway
You can't fix what you can't see. Invest in Observability early. When production is on fire at 2 AM, having a trace ID that points directly to the slow database query is better than hours of guessing.
MonitoringObservabilityDevOps
Share: